WP Debug Toolkit Review: Fix WordPress Errors Fast
WP Debug Toolkit turns the tedious process of WordPress debugging into a few clicks, with a standalone log viewer that works even when your site is completely down.

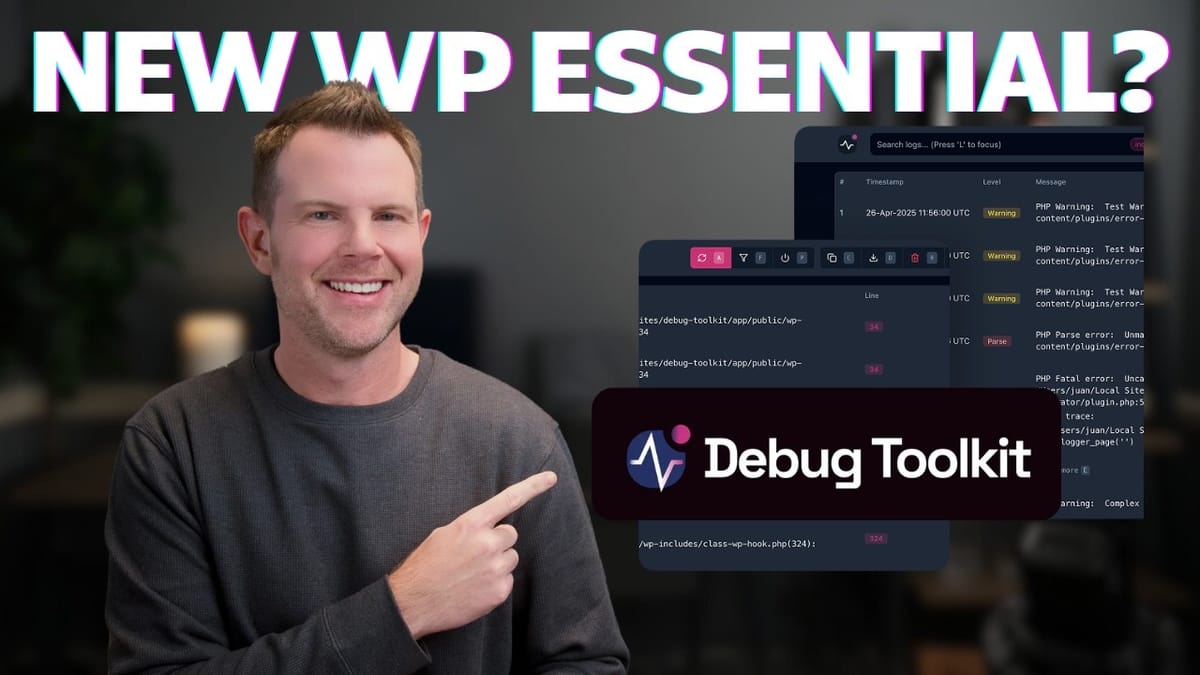
WP Debug Toolkit
A WordPress plugin that simplifies debugging by providing one-click debug mode toggling, a standalone log viewer that works even when WordPress is crashed, and built-in crash recovery tools.
WordPress developers, agency owners managing client sites, and site owners who need to troubleshoot plugin conflicts or code errors without SSH or FTP access.
Query Monitor, WP Debugging, Debug Bar, Health Check & Troubleshooting
What Problem Does WP Debug Toolkit Solve?
If you manage one or more WordPress websites, you already know the pain of tracking down errors. A plugin conflict breaks your checkout page, a code snippet tanks your theme, or a routine update sends your entire site into a white screen of death. The standard WordPress debugging workflow is functional but clunky: SSH or FTP into your server, locate the wp-config.php file, manually add the debug constants, reproduce the error, then dig through raw log files.
WP Debug Toolkit, built by the SoFly team, streamlines this entire process into a WordPress plugin. What started as an internal tool the team used across their own projects is now commercially available, and it addresses a real gap in the WordPress tooling ecosystem. The standout capability is that its log viewer operates independently of WordPress itself, meaning you can diagnose why your site crashed even when wp-admin is completely inaccessible.
This is part of the "What's Pressing" series, focused on WordPress tools that genuinely help you run and grow your business rather than getting caught up in ecosystem drama.
Pricing and Licensing
WP Debug Toolkit is available as a one-time payment, which is always nice to see in a market flooded with annual subscriptions. The single-site license runs $59, while the unlimited-site license is just $30 more at $89. Both tiers include the full feature set with no functionality gated behind the higher price.
For anyone managing more than one WordPress site, the unlimited license is the obvious choice. At $89 for lifetime access across every site you'll ever manage, it pays for itself the first time it saves you an hour of manual debugging on a client project.
Setup and Core Features
Installation follows the standard WordPress plugin workflow: download from the developer's site, upload to your WordPress installation, activate, and enter your license key. Once activated, WP Debug Toolkit lives in the left sidebar of wp-admin with a clean overview screen showing four main toggles.
The first two toggles handle **debug mode** and **error logging**. These replace the manual process of editing wp-config.php to add `WP_DEBUG` and `WP_DEBUG_LOG` constants. One click for each, and the config file is updated on your behalf. It's not a massive time saver in isolation, but when a client's site is down and the pressure is on, eliminating the SSH step and potential typos is genuinely valuable.
The third toggle controls **error display**, which renders PHP errors directly on the front end of your site. This should stay off on production sites since it exposes server information to visitors, but it's useful on staging environments where you want immediate visual feedback while developing.
The fourth and most powerful feature is the **log viewer**. When installed, it creates a standalone endpoint at `yoursite.com/wp-debug-toolkit` that operates completely independently of WordPress. This means even if WordPress is fatally crashed and wp-admin is inaccessible, you can still pull up the viewer, read your error logs, and identify exactly what went wrong.
Important Security Considerations
Before you get excited and leave debug mode running permanently, there are two critical reasons to treat this as a development-only tool. First, continuous error logging generates massive log files that will eventually consume all available disk space on your server, creating an entirely new problem. Second, debug mode exposes detailed server and application information that could be exploited by attackers.
The rule is simple: turn debugging on when you're actively troubleshooting, turn it off when you're done. If you do need to leave the viewer accessible on a production site temporarily, WP Debug Toolkit includes built-in password protection. Navigate to the viewer settings and enable the password toggle to lock down the endpoint. Don't skip this step on any publicly accessible site.
The Log Viewer: Filtering, Shortcuts, and Crash Recovery
The log viewer itself is well-designed for both casual users and power users. Keyboard shortcuts are mapped to every major function and clearly labeled in the UI. Press `A` to toggle auto-refresh (which polls for new log entries every five seconds), and similar single-key shortcuts handle filtering, copying, and navigation.
Filtering is where things get genuinely useful on busy sites. You can narrow logs by severity level (fatal errors, warnings, notices), by time window (last hour, 24 hours, or seven days), and by source (WordPress core, plugins, themes, or custom code). When you're staring at hundreds of log entries trying to find the one plugin that's throwing fatal errors, being able to filter down to just critical errors from plugins in the last hour is a massive time saver.
The **crash recovery** panel deserves special attention. It lets you disable all plugins or switch themes directly from the standalone viewer, without needing wp-admin access. Normally, this requires renaming plugin folders one by one via FTP. If you've ever inherited a client site running 70+ plugins and needed to isolate a conflict, you'll appreciate the one-click disable. Clicking the error's eyeball icon opens an inline code viewer showing the exact file and line number causing the issue, so you can diagnose and fix without switching between multiple tools.
Site Health and Bonus Features
WP Debug Toolkit includes a site health feature that extends WordPress core's built-in health check. It runs approximately 12 tests covering areas like SSL support, REST API security, and WP-Cron configuration. It's not groundbreaking, and you'll find overlap with the native WordPress site health tool, but the additional checks can surface configuration issues you might otherwise miss.
Rounding out the toolset are some practical quality-of-life features: one-click log copying (handy for pasting into an AI assistant or sharing with a developer), log file downloads for offline analysis or archiving, a clear-logs button to wipe old entries when you want a fresh baseline, and a light/dark mode toggle for the viewer interface.
One Feature I'd Love to See Added
There's one gap in the current workflow that, if addressed, would make WP Debug Toolkit essential for every WordPress site owner. Right now, to use the log viewer, you need debug mode and error logging enabled, which makes sense since there's nothing to view otherwise. But to enable those settings, you need access to wp-admin. And to uninstall the viewer for security purposes, you also need wp-admin.
The catch-22 is obvious: if your site crashes and you haven't already set up the viewer, you're back to the traditional SSH/FTP workflow. The ideal solution would be allowing the standalone viewer endpoint to activate debug mode and error logging on its own, since it already operates independently of WordPress. That way, even a non-technical site owner could navigate to the viewer URL after a crash, click a button to start logging, and immediately see what's going wrong. The SoFly team may already have this on their roadmap, but it's worth calling out as the one thing standing between this being a great debugging tool and a must-install plugin for every WordPress site.
Final Verdict: Should You Get WP Debug Toolkit?
WP Debug Toolkit isn't solving a problem that was previously unsolvable. WordPress debugging has always been possible through manual config edits and raw log files. What this tool does is remove the friction from every step of that process: toggling debug mode, reading logs, filtering errors, recovering from crashes, and viewing source code in context.
For WordPress developers and agency owners, the time savings compound quickly across multiple client sites. For less technical site owners, it makes debugging accessible without needing to learn SSH or understand server file structures. At a one-time cost of $89 for unlimited sites, it's the kind of tool that sits quietly in your plugin library until the day everything breaks, and then you're very glad you have it.
Even if you don't need it today, grabbing it now means you'll have it ready when trouble inevitably strikes. Every WordPress site breaks eventually. The question is how quickly you can figure out why.
Watch the Full Video
Prefer watching to reading? Check out the full video on YouTube for a complete walkthrough with live demos and commentary.